
By David Stockman on International Man (Parts 1 and 2 combined)
“The Chief of the European Central Bank (ECB) has said that climate change is behind soaring inflation, stating that droughts and famines are driving up prices.
“If more and more climate disasters, droughts, and famines occur throughout the world, there will be repercussions on prices, on insurance premiums, and on the financial sector,” Lagarde said.
“We need to take that into account.”
No, what we actually need to take into account is that the so-called Climate Crisis is complete hogwash, starting with the basics of so-called man-made global warming. The fact is, the present era is one of the coolest and least carbon-intensive periods of the last 600 million years.
Stated differently, the true science makes mincemeat of the elitist narrative espoused by Lagarde, officialdom through Europe and North America and the mainstream media. Yet it is now being used as an excuse for the unfolding economic disasters caused by the central banks and the Warfare State and a pretext for new rounds of authoritarian suppression of economic liberty exemplified by California’s recent move to outlaw combustion engine autos after 2035.
Indeed, the geological and paleontological evidence overwhelmingly says that today’s average global temperature of about 15 degrees C and CO2 concentrations of 420 ppm are nothing to fret about, and even if they rise to about 17-18 degrees C and 500-600 ppms by the end of the century, it may well on balance improve the lot of mankind.
After all, bursts of civilization during the last 10,000 years uniformly occurred during the red portion of the graph below–the river civilizations, the Minoan, the Greco-Roman era, the Medieval flowering and the industrial and technological revolutions of the present era. At the same time, the several lapses into dark ages happened when the climate turned colder (blue area).
And that’s only logical. When its warmer and wetter, growing seasons are longer and crop yields are better—regardless of the agricultural technology and practices of the moment. And it’s better for human and community health, too—most of the deadly plagues of history have occurred under colder climes, such as the Black Death of 1344-1350.

Yet the Climate Crisis Narrative shitcans this massive body of “the science” by means of two deceptive devices that invalidate the entire Anthropogenic Global Warming (AGW) story.
First, it ignores the entirety of the planet’s pre-Holocene (last 10,000 years) history, even though the science shows that more than 50% of the time in the last 600 million years global temperatures were in the range of 25 degrees C or 67% higher than current levels and far beyond anything projected by the most unhinged climate models today. But, crucially, at those temperature peaks planetary climate systems did not go into a doomsday loop of scorching meltdown—warming was always checked and reversed by powerful counter-veiling forces.
Even the history the alarmist do acknowledge has been grotesquely falsified. We are referring to the so-called “hockey stick” of the past 1000 years, which Al Gore made famous in his propaganda flick about global warming, which purports to show that temperatures were flat until 1850 and are now rising to allegedly dangerous levels.
But that’s a complete crock. It was fraudulently manufactured by the IPCC (International Panel on Climate Change) to “cancel” the fact that temperatures in the pre-industrial world of the Medieval Warm Period (1000-1200 AD) were actually higher than at present!
Secondly, it is falsely claimed that global warming is a one-way street in which rising concentrations of greenhouse cases (GHGs) and especially CO2 is causing the earth’s heat balance to continuously increase. The truth, however, is that higher CO2 concentrations are a consequence and by-product, not a driver and cause, of the current naturally rising temperatures.
Again, the now “canceled” history of the planet knocks the CO2-driver proposition into a cocked hat. During the Cretaceous Period between 145 and 66 million year ago a natural experiment provided complete absolution for the vilified CO2 molecule. During that period, global temperatures rose dramatically from 17 degrees C to 25 degrees C—a level far above anything today’s Climate Howlers have ever projected.
Alas, CO2 wasn’t the culprit. According to the science, ambient CO2 concentrations actually tumbled during that 80 million years expanse, dropping from 2,000 ppm to 900 ppm on the eve of the Extinction Event 66 million years ago.
You would think that this powerful countervailing fact would give the CO2 witch-hunters pause, but that would be to ignore what the whole climate change brouhaha is actually about. That is, it’s not about science, human health and well being or the survival of planet earth; it’s about politics and the ceaseless search of the political class and the apparatchiks and racketeers who inhabit the Washington beltway for still another excuse to aggrandize state power.
Indeed, the Climate Change Narrative is the kind of ritualized policy mantra that is concocted over and again by the political class and the permanent nomenklatura of the modern state—professors, think tankers, lobbyists, career apparatchiks, officialdom—in order to gather and exercise state power.
To paraphrase the great Randolph Bourne, inventing purported failings of capitalism—such as a propensity to burn too much hydrocarbon—is the health of the state. Indeed, fabrication of false problems and threats that purportedly can only be solved by heavy-handed state intervention has become the modus operandi of a political class that has usurped near complete control of modern democracy.
So doing, however, the ruling elites have gotten used to such unimpeded success that they have become sloppy, superficial, careless and dishonest. For instance, the minute we get an ordinary summer heat wave of the kind Christine Lagarde was yapping about, these natural weather events are jammed into the global warming narrative with nary a second thought by the lip-syncing journalists of the MSM.
Yet there is absolutely no scientific basis for all this tom-tom beating. In fact, NOAA publishes a heat wave index based on extended temperature spikes which last more than 4 days and which would be expected to occur once every ten years based on the historical data.
As is evident from the chart below, the only true heat wave spikes we have had in the last 125 years were during the dust bowl heat waves of the 1930s. The frequency of mini-heat wave spikes since 1960 is actually no greater than it was during the 1895-1935 period.

Likewise, all it takes is a good Cat 2 hurricane and they are off to the races, gumming loudly about AGW (Anthropogenic Global Warming). Of course, this ignores entirely NOAA’s own data as summarized in what is known as the ACE (accumulated cyclone energy) index.
This index was first developed by the renowned hurricane expert and Colorado State University professor, William Gray. It uses a calculation of a tropical cyclone’s maximum sustained winds every six hours. The latter is then multiplied by itself to get the index value and accumulated for all storms for all regions to get an index value for each year as shown above.
This chart covers the past 170 years, where the red line is the annual figure and the blue line represents the seven-year rolling average.
Your editor has an especial regard for the expertise of William Gray. Back in our private equity days we invested in a Property-Cat company, which was in the super-hazardous business of insuring against the extreme layers of damage caused by very bad hurricanes and earthquakes. So setting the premiums correctly was no trifling business and it was the analytics, long-term data bases and current year forecasts of Professor Gray upon which our underwriters crucially depended.
That is to say, hundreds of billions of insurance cover was then and still is being written with ACE as a crucial input.
Yet if you examine the 7-year rolling average (blue line) in the chart, it is evident that ACE was as high or higher in the 1950s and 1960s as it is today, and that the same was true of the late 1930s and the 1880-1900 periods.
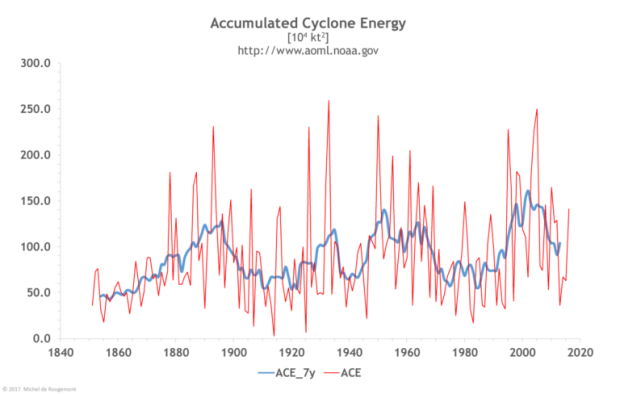
The above is an aggregate index of all storms and is therefore as comprehensive a measure as exists.
But for want of doubt, the next three panels look at hurricane data at the individual storm count level. The pink portion of the bars represent the number of big Cat 3-5 storms, while the red portion reflects the number of Cat 1-2 storms and the blue the number of tropical storms that did not reach Cat 1 intensity.


The bars accumulate the number of storms in 5-year intervals and reflect recorded activity back to 1851. The reason we present three panels—for the Eastern Caribbean, Western Caribbean and Bahamas/Turks & Caicos, respectively, is that the trends in these three sub-regions clearly diverge. And that’s the smoking gun.
If global warming were generating more hurricanes as the MSM constantly maintains, the increase would be uniform across all of these sub-regions, but it’s clearly not.
Since the year 2000, for example,
- The Eastern Caribbean has had a modest increase in both tropical storms and higher rated Cats relative to most of the past 170 years;
- The Western Caribbean has not been unusual at all, and, in fact, has been well below the counts recorded during the 1880-1920 period;
- The Bahamas/Turks & Caicos region since 2000 has actually been well weaker than during 1930-1960 and 1880-1900.
The actual truth of the matter is that Atlantic hurricane activity is generated by atmospheric and ocean temperature conditions in the eastern Atlantic and North Africa. Those forces, in turn, are heavily influenced by the presence of an El Nino or La Nina in the Pacific Ocean.
El Niño events increase the wind shear over the Atlantic, producing a less-favorable environment for hurricane formation and decreasing tropical storm activity in the Atlantic basin. Conversely, La Niña causes an increase in hurricane activity due to a decrease in wind shear.
These Pacific Ocean events, of course, have never been correlated with the low level of natural global warming now underway.
The number and strength of Atlantic hurricanes may also undergo a 50–70 year cycle known as the Atlantic Multidecadal Oscillation. Again, these cycles are unrelated to global warming trends since 1850.
Still, scientists have reconstructed Atlantic major hurricane activity back to the early eighteenth century (@1700) and found five periods averaging 3–5 major hurricanes per year and lasting 40–60 years each; and six other periods averaging 1.5–2.5 major hurricanes per year and lasting 10–20 years each. These periods are associated with a decadal oscillation related to solar irradiance, which is responsible for enhancing/dampening the number of major hurricanes by 1–2 per year, and clearly not a product of AGW.
Moreover, like in all else the very long term records of storm activity also rule out AGW because there was none for most of the time during the last 3,000 years, for instance. Yet according to a proxy record for that period from a coastal lake on Cape Cod, hurricane activity has increased significantly during the last 500-1,000 years—long before industrialization and fossil fuel burning— compared to earlier periods.
In short, there is no reason to believe that these well understood precursor conditions and longer-term trends have been impacted by the modest increase in average global temperatures since the LIA (Little Ice Age) ended in 1850.
–
As it happens, the same story is true with respect to wildfires—the third category of natural disaster that the Climate Howlers have glommed onto. But in this case it’s bad forestry management, not man-made global warming, which has turned much of California into a dry wood fuel dump.
And don’t take our word for it. This comes from the George Soros funded Pro Publica, which is not exactly a right-wing tin foil hat outfit. It points out that environmentalists have so shackled Federal and state forest management agencies that today’s tiny “controlled burns” are but an infinitesimal fraction of what Mother Nature herself accomplished before the helping hand of today’s purportedly enlightened political authorities arrived on the scene:
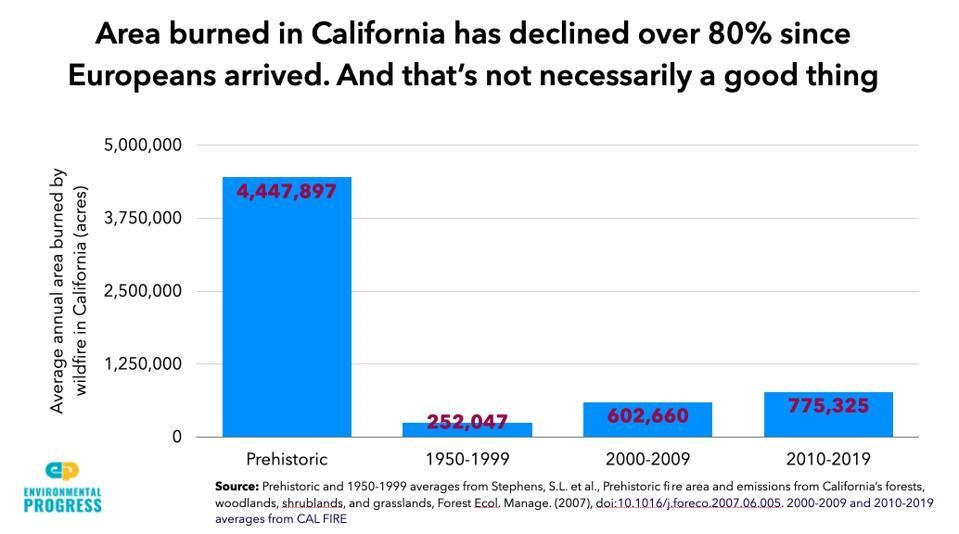
“Academics believe that between 4.4 million and 11.8 million acres burned each year in prehistoric California. Between 1982 and 1998, California’s agency land managers burned, on average, about 30,000 acres a year. Between 1999 and 2017, that number dropped to an annual 13,000 acres. The state passed a few new laws in 2018 designed to facilitate more intentional burning. But few are optimistic this, alone, will lead to significant change.
We live with a deathly backlog. In February 2020, Nature Sustainability published this terrifying conclusion: California would need to burn 20 million acres — an area about the size of Maine — to restabilize in terms of fire.”
In short, if you don’t clear and burn-out the deadwood, you build-up nature-defying tinder-boxes that then require only a lightning strike, a spark from an un-repaired power line or human carelessness to ignite into a raging inferno. As one 40-year conservationist and expert summarized,
“ …. There’s only one solution, the one we know yet still avoid. “We need to get good fire on the ground and whittle down some of that fuel load.”
In fact, a dramatically larger human footprint in the fire-prone shrub-lands and chaparral (dwarf trees) areas along the coasts increases the risk residents will start fires. California’s population nearly doubled from 1970 to 2020, from about 20 million people to 39.5 million people, and nearly all of the gain was in the coastal areas.
Under those conditions, California’s strong, naturally-occurring winds, which crest periodically, are the main culprit which fuels and spreads the human set blazes in the shrub-lands. The Diablo winds in the North and Santa Ana winds in the South can actually reach hurricane force. As wind moves West over California mountains and down toward the coast, it compresses, warms and intensifies. The winds blow flames and carry embers, spreading the fires quickly before they can be contained.
Among other proofs that industrialization and fossil fuels aren’t the culprit is the fact that researchers have shown that when California was occupied by indigenous communities, wildfires would burn up some 4.5 million acres a year. That’s nearly 6X the 2010-2019 period, when wildfires burned an average of just 775,000 acres annually in California.
Beyond the untoward clash of all of these natural forces of climate and ecology with misguided government forest and shrub-land husbandry policies, there is actually an even more dispositive smoking gun, as it were.
To wit, the Climate Howlers have not yet embraced the apparent absurdity that the planet’s purportedly rising temperatures have targeted the Blue State of California for special punishment. Yet when we look at the year-to-date data through August for forest fires we find, alas, that unlike California and Oregon, the US as a whole is now experiencing the weakest fire years since 2010.
That’s right. As of August 24 each year, the 10-year average burn has been 5.114 million acres across the US, but in 2020 it was 28% lower at 3.714 million acres.
National fire data year to date:
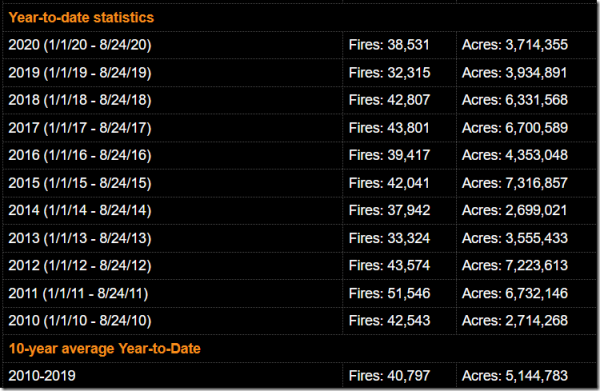
Indeed, what the above chart shows is that on a national basis there has been no worsening trend at all during the last decade, just huge oscillations year-to-year driven not by some grand planetary heat vector but by changing local weather and ecological conditions.
You just can’t go from 2.7 million burned acres in 2010 to 7.2 million burned acres in 2012 and then back to 3.9 million burned acres in 2019 and 3.7 million acres in 2020 and argue along with the Climate Howlers that the planet is angry.
To the contrary, the only real trend evident is that on a decadal basis during recent times that average forest fire acreage in California has been slowly rising, owing to the above described dismal failure of government forest management policies. But even the mildly rising average fire acreage trend since 1950 is a rounding error compared to the annual averages from prehistoric times, which were nearly 6X greater than during the most recent decade.
Furthermore, the gently risen trend since 1950, as shown below, should not be confused with the Climate Howlers bogus claim that California’s fires have “grown more apocalyptic every year,” as The New York Times reported.
In fact, they are comparing 2020’s above average burn to 2019, which saw an unusually small amount of acreage burned—just 280,000 acres compared to 1.3 million and 1.6 million in 2017 and 2018, respectively, and 775,000 on average over the last decade.
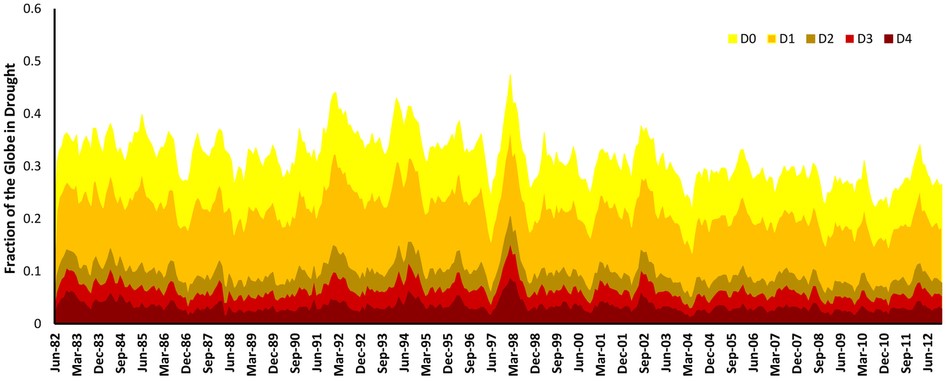
Nor is this lack of correlation with global warming just a California and US phenomena. As shown in the chart below, the global extent of drought, measured by five levels of severity with brown being the most extreme, has shown no worsening trend at all during the past 40 years.
Global Extent of Five Levels Of Drought, 1982-2012
This brings us to the gravamen of the case. There is no climate crisis whatsoever, but the Global Warming hoax has so thoroughly contaminated the mainstream narrative and the policy apparatus in Washington and capitals all around the world that contemporary society is fixing to commit economic hari-kari.
That’s because in contradiction to the phony case that the rise of fossil fuel use after 1850 has caused the planetary climate system to become unglued, there has been a massive acceleration of global economic growth and human well-being. And one essential element behind that salutary development has been the massive increase in the use of cheap fossil fuels to power economic life.
The chart below could not be more dispositive. During the pre-industrial era between 1500 and 1870, global real GDP crawled along at just 0.41% per annum. By contrast, during the past 150 years of the fossil fuel age global GDP growth accelerated to 2.82% per annum–or nearly 7 times faster.
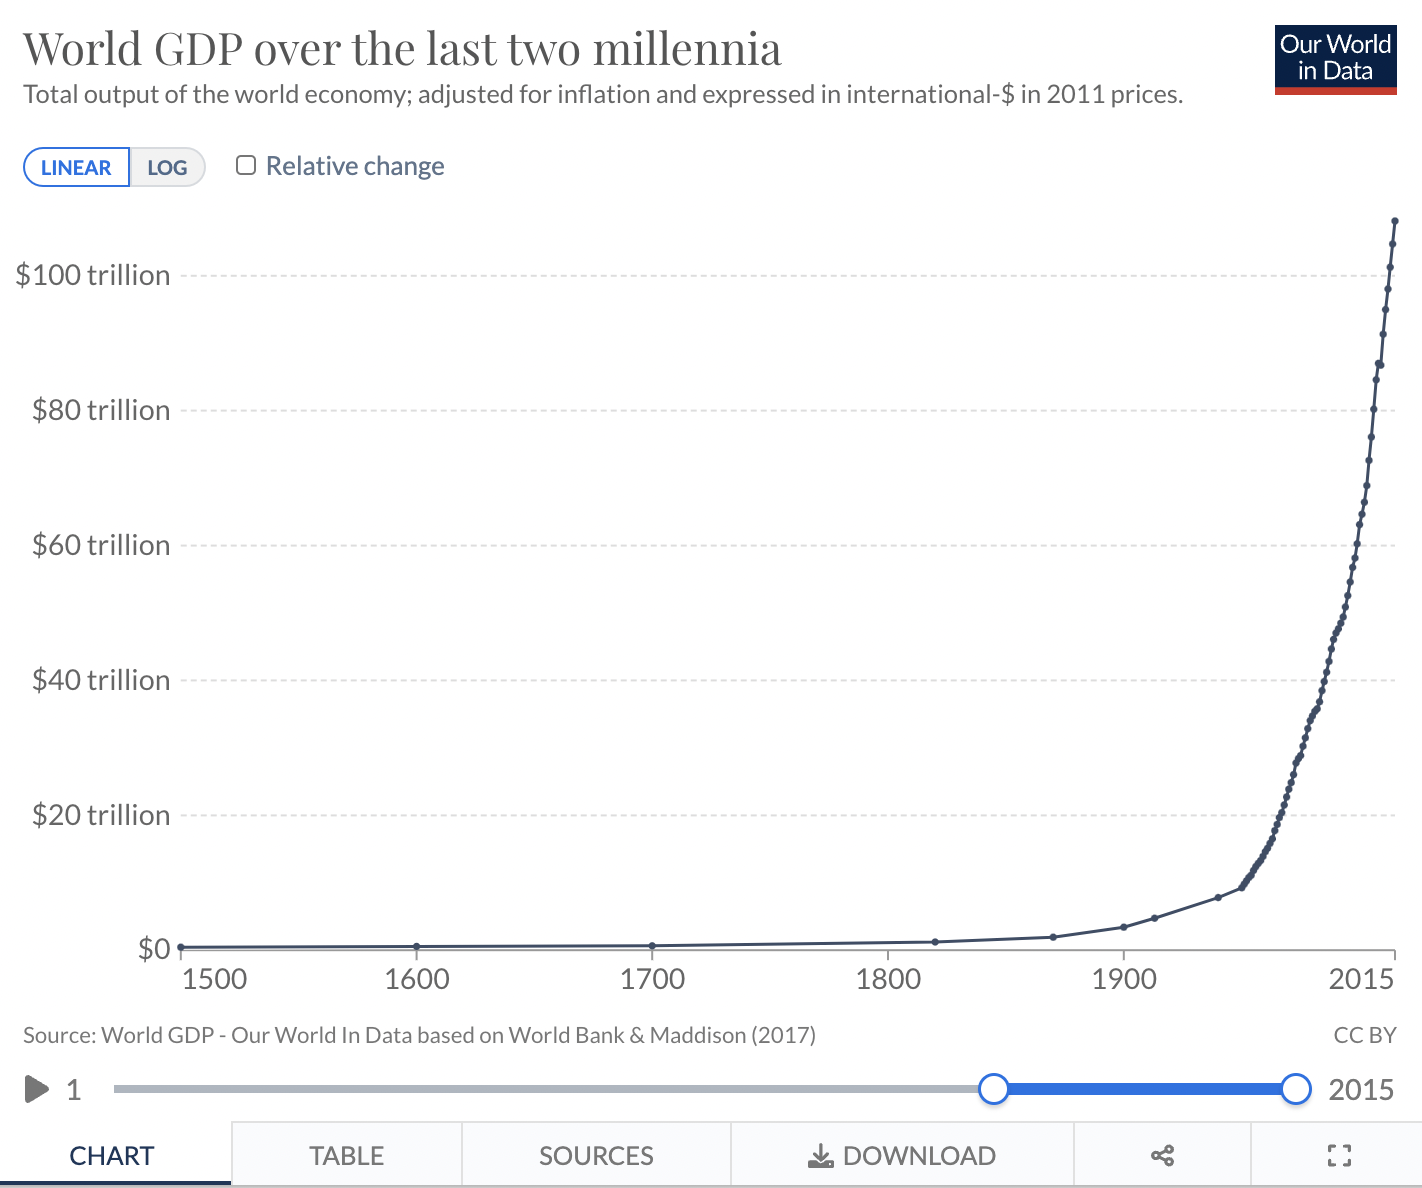
This higher growth, of course, in part resulted from a larger and far healthier global population made possible by rising living standards.
Yet it wasn’t human muscle alone that caused the GDP level to go parabolic as per the chart above.
It was also due to the fantastic mobilization of intellectual capital and technology.
And one of the most important vectors of the latter was the ingenuity of the fossil fuel industry in unlocking the massive trove of stored work that Mother Nature extracted, condensed and salted away from the incoming solar energy over the long warmer and wetter eons of the past 600 million years.
Needless to say, the curve of world energy consumption tightly matches the rise of global GDP shown above.
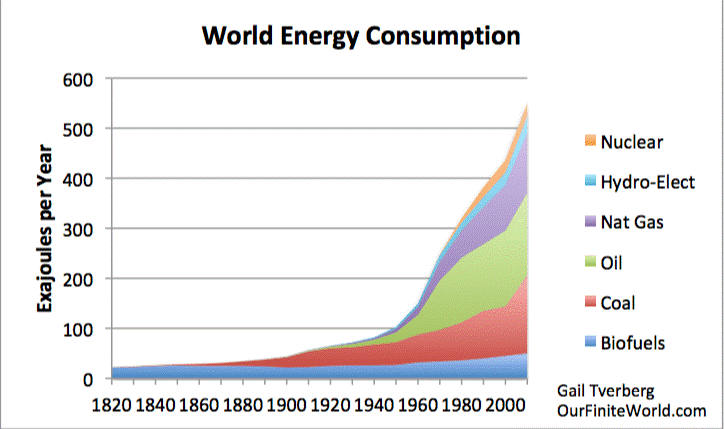
Thus, in 1860 global energy consumption amounted to 30 exajoules per year and virtually 100% of that was represented by the blue layer labeled “biofuels”, which is just a polite name for wood and the decimation of the forests which it entailed.
Since then, annual energy consumption has increased 18-fold to 550 exajoules (@100 billion barrels of oil equivalent), but 90% of that gain was due to natural gas, coal and petroleum. The modern world and today’s prosperous global economy would simply not exist absent the massive increase in the use of these efficient fuels, meaning that per capita income and living standards would otherwise be only a small fraction of current levels.
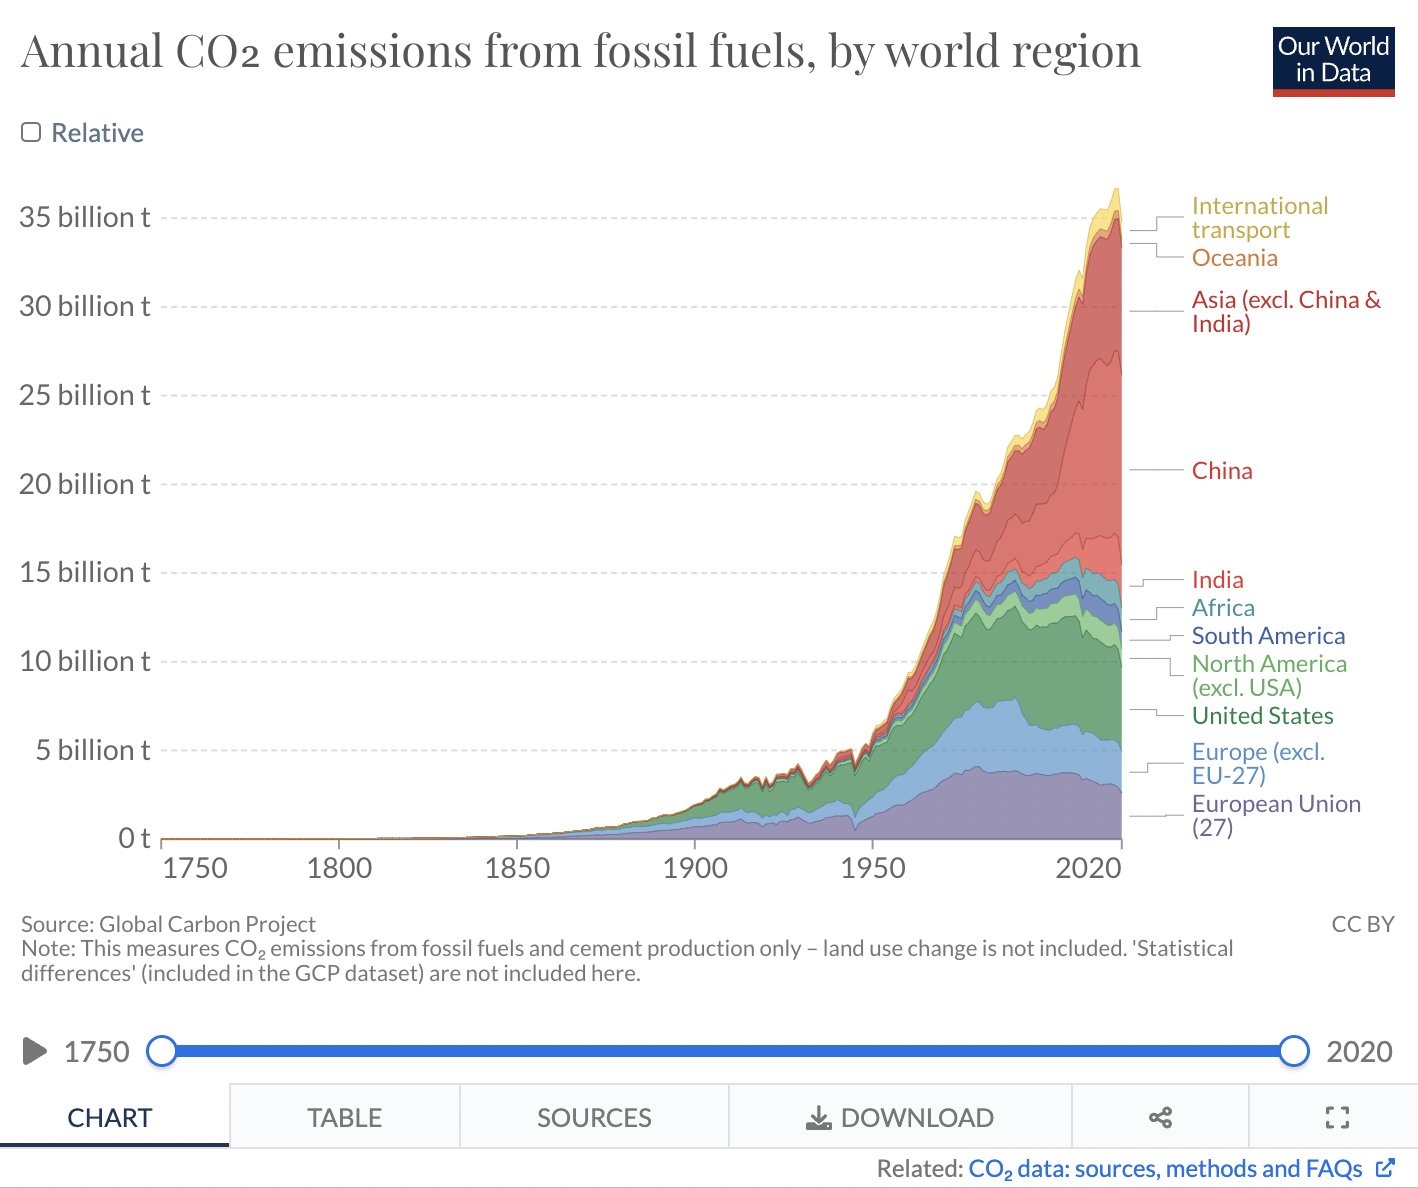
Yes, that dramatic rise in prosperity generating fossil fuel consumption has given rise to a commensurate increase in CO2 emissions. But contrary to the Climate Change Narrative, CO2 is not a pollutant!
As we have seen, the correlated increase in CO2 concentrations—from about 290 ppm to 415 ppm since 1850—amounts to a rounding error in both the long-trend of history and in terms of atmospheric loadings from natural sources.
As to the former, concentrations of less than 1000 ppm are only recent developments of the last ice age, while during prior geologic ages concentrations reached as high as 2400 ppm.
Likewise, the oceans contain an estimated 37,400 billion tons of suspended carbon, land biomass has 2,000-3,000 billion tons and the atmosphere contains 720 billion tons of CO2 or 20X more than current fossil emissions shown below.
Of course, the opposite side of the equation is that oceans, land and atmosphere exchange CO2 continuously so the incremental loadings from human sources is very small.
More importantly, even a small shift in the balance between oceans and air would cause a much more severe rise/fall in CO2 concentrations than anything attributable to human activity.
But since the Climate Howlers falsely postulate that the pre-industrial level of 290 parts per million was extant since the Big Bang and that the modest rise since 1850 is a one-way ticket to boiling the planet alive, they obsess over the “sources versus sinks” balance in the carbon cycle for no valid reason whatsoever.
Actually, the continuously shifting carbon balance of the planet over any reasonable period of time is a big, so what!