
Originally published by Phil Harper with the title “The Can’t Add TOGETHER Trial”
If a study has a press release strategy, it’s fair to assume that its motivations are more aligned with good press rather than good science. On March 18th, the world was treated to another negative headline: “Ivermectin Didn’t Reduce Covid-19 Hospitalizations in Largest Trial to Date”. It wasn’t possible for the journalist to interrogate that claim, because the study hadn’t been published. Nonetheless, the headline was dutifully beamed out by the Wall Street Journal in another example of “Science by Press Release”.
PR teams plan to get ‘good press’ before the study is published so that even if the study is terrible, the headline is shared far and wide before its claims can be tested. If headlines are what you want, it’s a win-win strategy.
Two weeks after the world was gifted with the headlines that “Ivermectin doesn’t work” we are presented with the published study. It can now be interrogated after the headlines already made their way around the world, and I don’t expect to see headlines about any of the issues I’m about to detail. However, all is not lost, we can undo some of that damage if the problems I am about to detail reach people in a position to do something about it.
This is the Ivermectin TOGETHER trial, something we’ve waited years for. It’s finally here! And as many of us predicted, there are some serious issues with it. Despite the expected problems, very few were prepared for the number of serious issues that would be discovered. This post will focus only on the numerical issues which discredit the study. The digging will come later…for now, I’ll focus on the numerical issues.
Missing patients in the subgroup analysis
There were two arms to the study, Ivermectin and placebo. The study enrolled 679 patients in each arm, so 679 patients took Ivermectin and 679 took a placebo.
Part of the study looked at subgroups within those arms to compare how they did. It broke down patients by weight, cardiovascular disease, lung disease and ‘time since onset of symptoms’. That’s the number of days the patient had shown symptoms when they presented to the clinic to enrol in the study.
Here’s the issue, the size of the broken down groups should all add up to 679 patients, but they do not. In the Ivermectin ‘arm’ of the study, there’s an ‘age subgroup’ which lists 335 patients older or equal to 50 years old, and 295 younger than 50 years old. But that only adds to 630 patients, suggesting that 49 patients were neither younger, equal to, or older than 50 years old. These problems are apparent right the way through the subgroup analysis, where the totals rarely add up to 679 patients. A list of the missing patients is shown in the table below the original data, which is below.
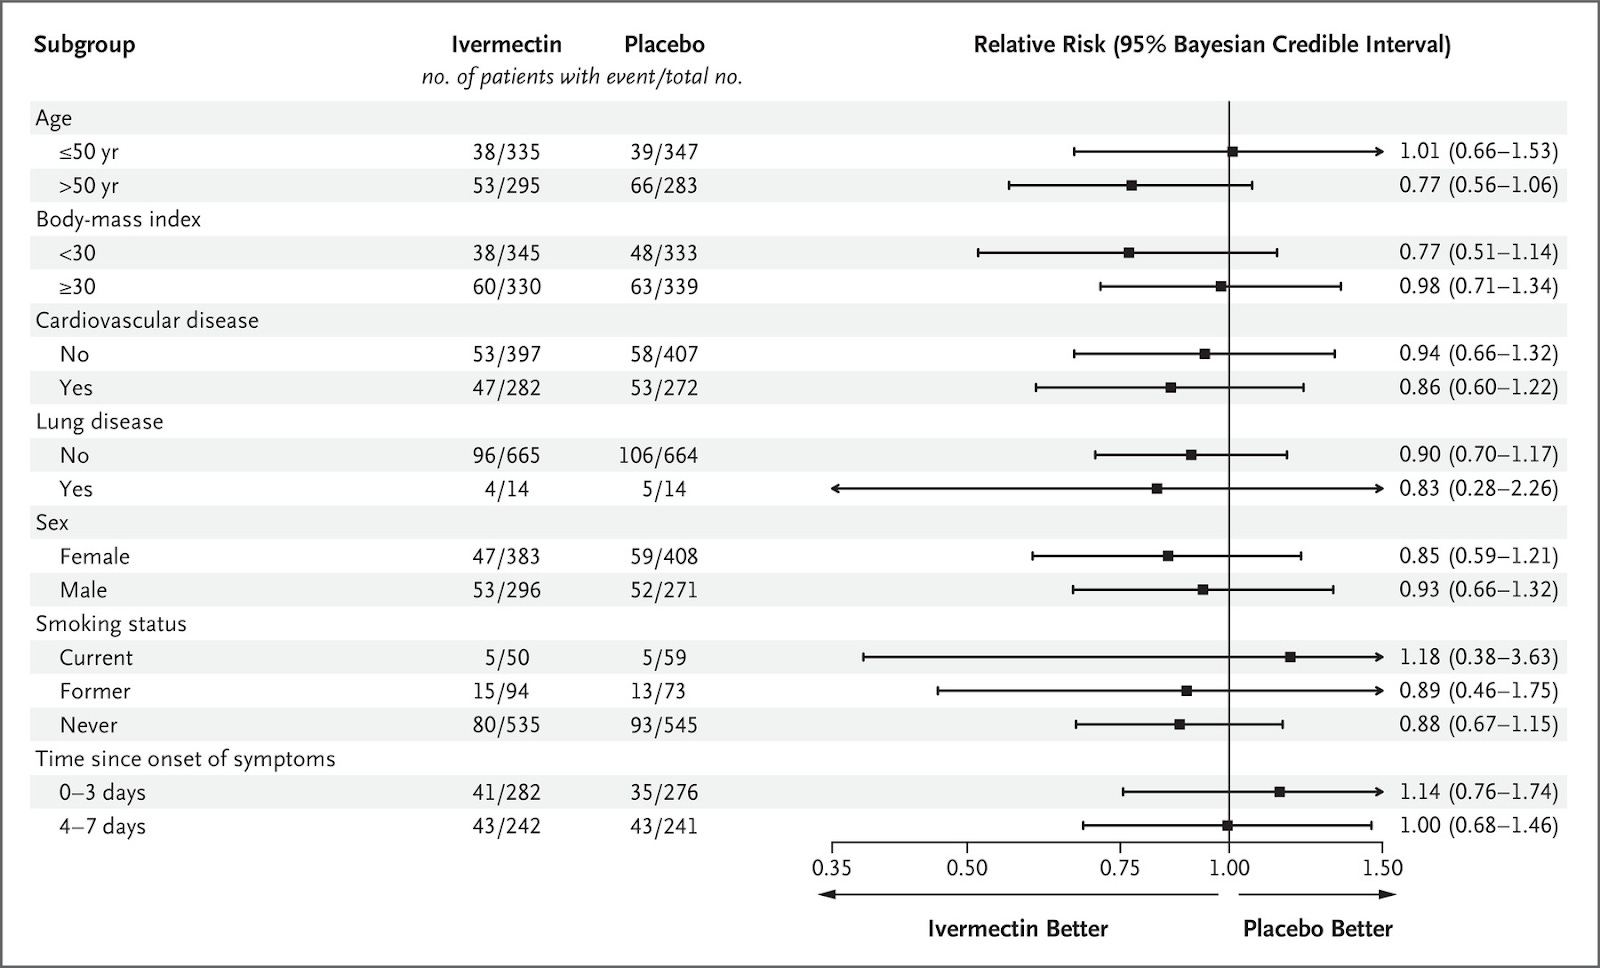
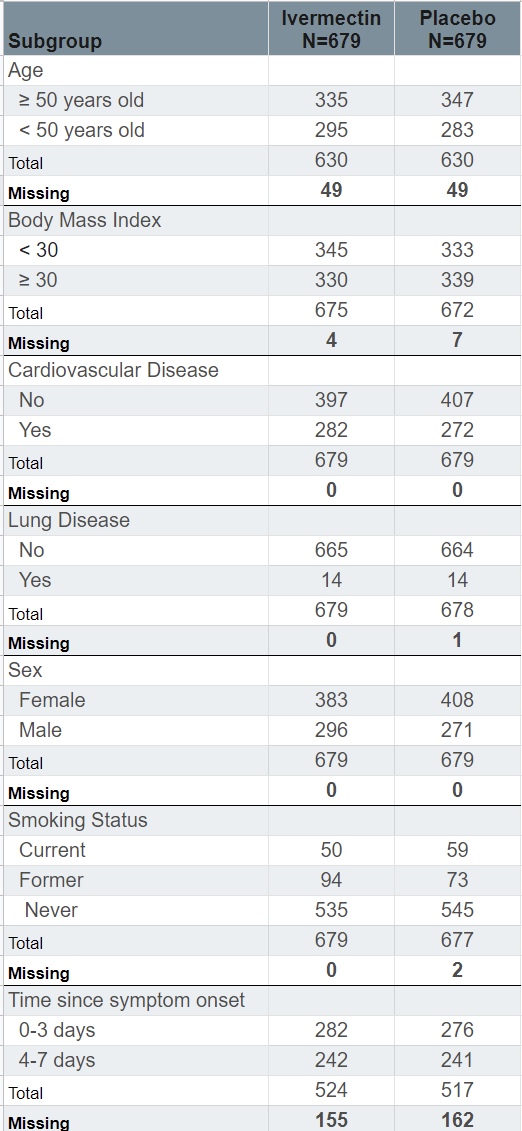
The biggest discrepancy is in the ‘Time since Symptom Onset’ subgroup, where there are 155 patients missing from the Ivermectin arm, and 162 patients missing from the placebo arm. It suggests that patients may have been included in the study that were neither 0-3 days nor 4-7 days from symptom onset, which should have excluded them from the study.
It raises the question, what happened to these missing patients? Why were they excluded from the subgroup analysis? It is not a small discrepancy. In the ‘Time since symptom onset’ subgroup, there are 317 patients missing, which is 23% of the entire study sample.
The number of deaths counted is inconsistent
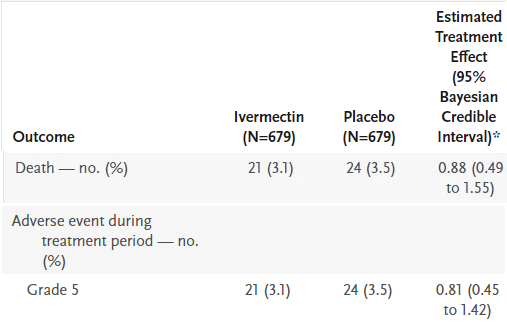
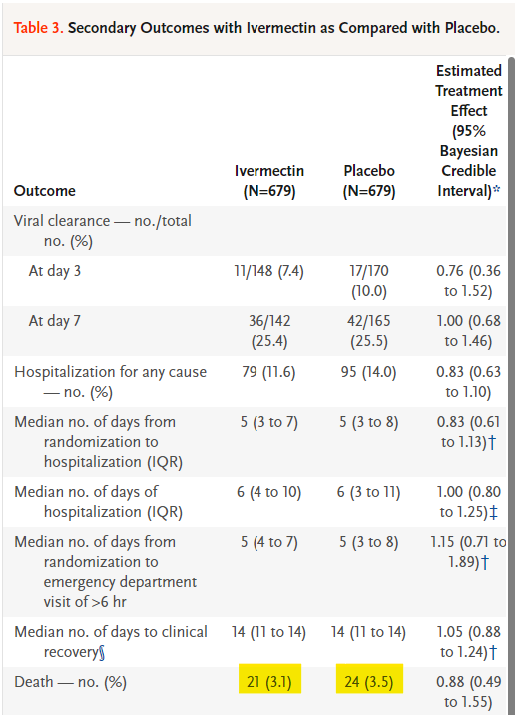
On Table 3, “Secondary Outcomes with Ivermectin as Compared with Placebo” we see that 21 died in the Ivermectin wing, and 24 died in the placebo wing. Further down in the table, we see these deaths again, but this time they are listed under a different category: a ‘Grade 5 Adverse Event”. I’ve deleted the irrelevant data from the table so it’s clear.
However, in the supplementary appendix which is the table below, the Adverse Events are broken down so we can see what kind of adverse reaction led to what kind of ‘event’. A ‘Grade 5 Adverse Event’ is ‘Death’, so we should see the same number of deaths in Table S6 as in Table 3, but we do not. We see 20 deaths in Ivermectin, and 25 deaths in placebo. So which is it, 21 vs 24, or 20 vs 25? The numbers used in the study worsen outcomes for Ivermectin, and improve outcomes for the placebo.
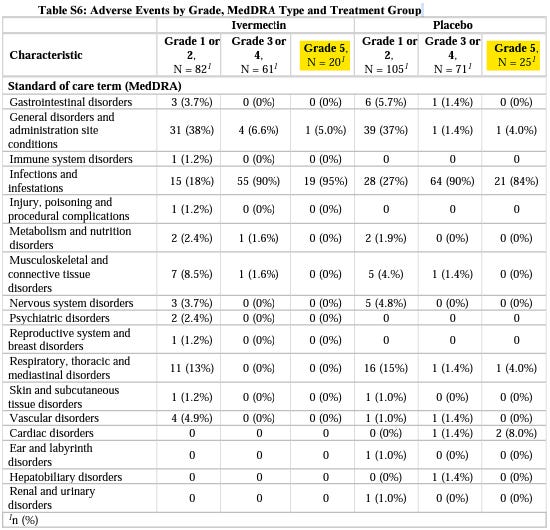
Question to answer: Why do the deaths tally incorrectly between Table S6 and Table 3 in a manner which favours placebo over Ivermectin?
‘Per-protocol’ numbers are contradictory

In the chart above, we’re shown what happened to the patients who enrolled in the study. In the middle path, we’re looking at what happened to the placebo group. 679 were assigned to receive a placebo and 679 received a placebo. So far so good.
The issue is that we’re then told ‘228 were included in the per-protocol analysis’, this is a critical number. It’s the number of patients who reported “100% adherence to the assigned regimen”, which means it’s the number of patients who actually completed the study.
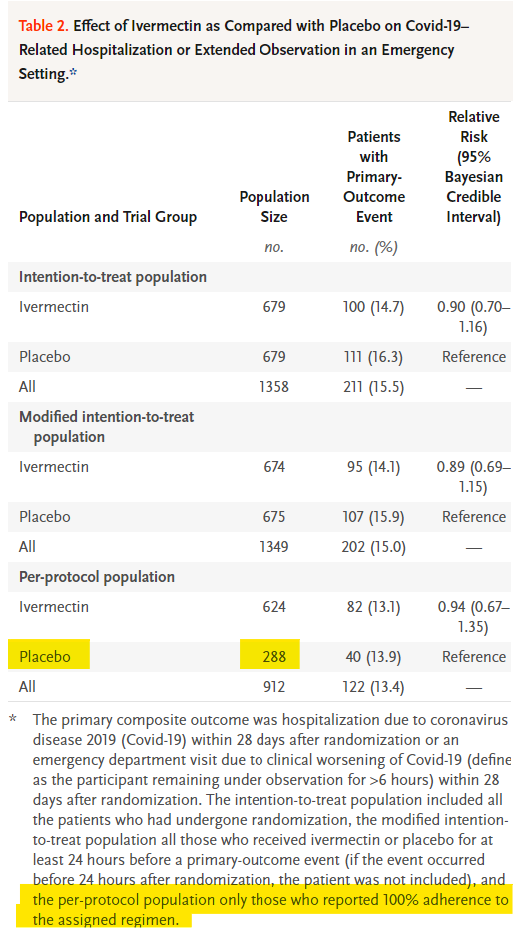
However, in Table 2 we are again given the ‘per-protocol’ numbers in both the Ivermectin arm and the placebo arm. This time it tells us there were 288 patients in the placebo ‘per-protocol population’. One diagram shows us it’s 228, and another diagram tells us it’s 288. So which is it? The true number is critical to calculating the size of the effect.
Significant numbers of patients left the study in the placebo wing but not the Ivermectin wing
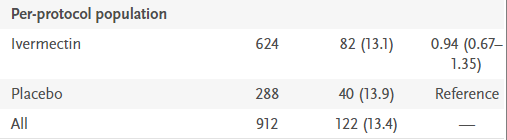
Let’s return to Table 2, and examine the ‘per-protocol population’ a little further. Remember, this is the number of patients “who reported 100% adherence to the assigned regimen”, the patients who fully completed the study.
In the Ivermectin wing, we see 624 patients out of 679 completed the study, and yet in the placebo arm, just 288 completed the study. Or 228, depending on which of the two reported numbers you’d prefer to use. Being generous, let’s assume that 288 completed the study. It means 391 patients in the placebo arm, or 58% of the entire group failed to complete the full study. Why?
In the Ivermectin arm, that number was just 55, or 9% of the total. That means there was a 710% increase (55 vs 391) in patient drop off in the placebo arm over the Ivermectin arm: how can such a huge discrepancy be explained?
Why is this a problem? Because this was supposed to be a Randomized Control Trial (RCT), where patients didn’t know if they had received a placebo or Ivermectin. Seeing a significant drop-off of patients on the placebo side suggests patients knew they had been given a placebo, so they terminated the study and self-medicated.
Allow me to explain. We know the patients enrolled in the study definitely had Covid-19, it was confirmed via PCR test. We also know these patients were higher-risk groups: older, overweight, co-morbidities and so on. So imagine the scenario: you’re sick, you register for the medical trial, and perhaps your hope is to receive free treatment for your confirmed case of Covid-19. You’re given the drug, and you’re not supposed to know if you got a placebo or the active compound. But somehow, you come to learn that your drug is the placebo – what do you do? You’re now thinking, “I’m sick, and I’m not receiving the active drug”, so you terminate your involvement in the trial and self medicate with Ivermectin.
How would patients come to know they had a placebo? They talk to each other, they compare the taste of their medicine, someone figures it out, and the news spreads. It is not rocket science. The sheer scale of patient drop off in the placebo wing is highly indicative of a problem in the blinding of the study.
But how would patients self medicate? Is self-medication with Ivermectin possible in Brazil? The study itself acknowledges it: “in Brazil, in particular, the use of ivermectin for the treatment of Covid-19 has been widely promoted”. Patients knew Ivermectin was a viable treatment for Covid-19, they likely wanted to be treated for free, and when they figured out they’d been given a placebo, they quit so as to find Ivermectin or another treatment themselves. Availability of Ivermectin in Brazil is very high, it can be readily bought over the counter.
The question that needs answering: How can such a huge drop off in patients be explained in a manner other than the trial became unblinded? Were patients interviewed about their decision to not complete the study? If it wasn’t patients that decided to not complete the study, and it was trial designers who terminated their participation, what reason was given, what methodology was used, and did it introduce a bias?
An incorrect denominator was used to calculate the effect size
As we just saw, not everyone enrolled completed the study, but these patients have been counted as though they completed the study. This skews the results.
In Table 3, “Secondary Outcomes with Ivermectin as Compared with Placebo”, the “N” size at the top of the table is the number of patients used to calculate efficacy for both Ivermectin and placebo. The idea is to see how many patients from the Ivermectin group died vs how many patients from the placebo group died. The issue is that there’s a mixup in the denominator, how many people were actually in each group. In the ‘Death’ outcome, they’ve reported deaths as a percentage of 679 patients, but that was not the correct number of patients to use. Allow me to explain.
The 679 number comes from the patients they intended to treat. That group is helpfully called the intention-to-treat population. It’s the number of patients who enrolled in each arm of the study. That’s 679 in the Ivermectin group, and 679 in the placebo group. However, as we have just seen, not everyone “reported 100% adherence” to the study. Some patients dropped off for reasons unknown.
The people who reported 100% adherence to the study are called the per-protocol group. These are the patients which should have been used as the “N size” in the table above. Why? Because these are the patients who actually received the full course of treatment. How can we use patients who did not receive the full course of treatment to calculate if the course of treatment is working or not?
We cannot. But that is what was done here.
In the Ivermectin arm, 624 patients were in the per-protocol population, and yet in the ‘Death’ outcome, all 679 patients, even those that didn’t receive full treatment, were included in the analysis. It means that 55 patients were included and analyzed within this group, even though they didn’t finish the study. If patients did not receive the treatment but their outcome was measured and included in the analysis, it drastically alters the results.
To be clear: patients who did not receive treatment cannot be included in an analysis investigating how they responded to treatment….because they didn’t receive the treatment.
This same problem is reflected in the placebo group, where the “N size” was also taken from the intention-to-treat population: 679. However here the problem gets much worse because the per-protocol population in the placebo group was significantly different at just 288 patients. A total of 391 patients in the placebo group didn’t report “100% adherence to the assigned regiment” and yet their outcomes were still included in the “Death” outcome analysis. If they were no longer part of the study, and were potentially self-medicating with Ivermectin or other drugs, their outcomes cannot be included in the analysis!
There were 24 deaths reported in the placebo subgroup analysis, but the “Estimated Treatment Effect” was calculated as if they were 24 deaths amongst 679 patients, even though only 288 completed the full study. The correct interpretation would be to calculate the effect from 24 deaths amongst 288 patients which produces drastically different results.
These problems run throughout the analysis of the secondary outcomes, where most of the subgroup calculations used the wrong denominator to calculate the size of the effect.
Question to answer: Why were patients who had not received the full course of treatment included in the calculation determining the size of the effect?
Making sure this is understood
The ivermectin arm should have reported 21 deaths in 624 patients, as that’s how many patients fully completed the study. The placebo group should have reported 24 deaths in 288 patients, as that’s how many patients fully completed the study.
Instead each arm reported the number of deaths among the number of patients initially enrolled even though those patients did not complete the study. By not comparing like for like groups, all notions of ‘randomized control’ are gone from the trial, and it drastically alters the results.
These issues warrant an official response from the New England Journal of Medicine. How can these errors not have been picked up in a study which finished enrolling patients seven months ago? If these issues aren’t resolved, a formal letter demanding a retraction of the paper is almost certain to materialize. The problems warrant a proper investigation of the raw data used in the study.
As ever, please share with those you think will be interested.
Bonus error
Below we see two sets of identical numbers, for what are essentially identical outcomes: Death and ‘Grade 5 adverse event’. Despite identical numbers and identical denominators, there are different outcomes in the Estimated Treatment Effect. How?
